

Valentine’s Day is behind us.
The trucks have stopped rolling. The coolers are quieter. The teams are finally catching their breath. And as leaders, we now enter the most important phase of any major holiday, the reflection phase.
Last Friday on my podcast, I began a conversation about the most important customer on February 14th and the best retail metric I’ve found to evaluate whether a floral operation was truly prepared for him. I want to expand that conversation here, because if we study this carefully, it can fundamentally change how we plan next year.
Who Is the Most Important Customer on Valentine’s Day?
Yes, there are growing segments: Galentine’s gifting, Palentine’s, self-purchase, and younger shoppers. Those trends are real and exciting.
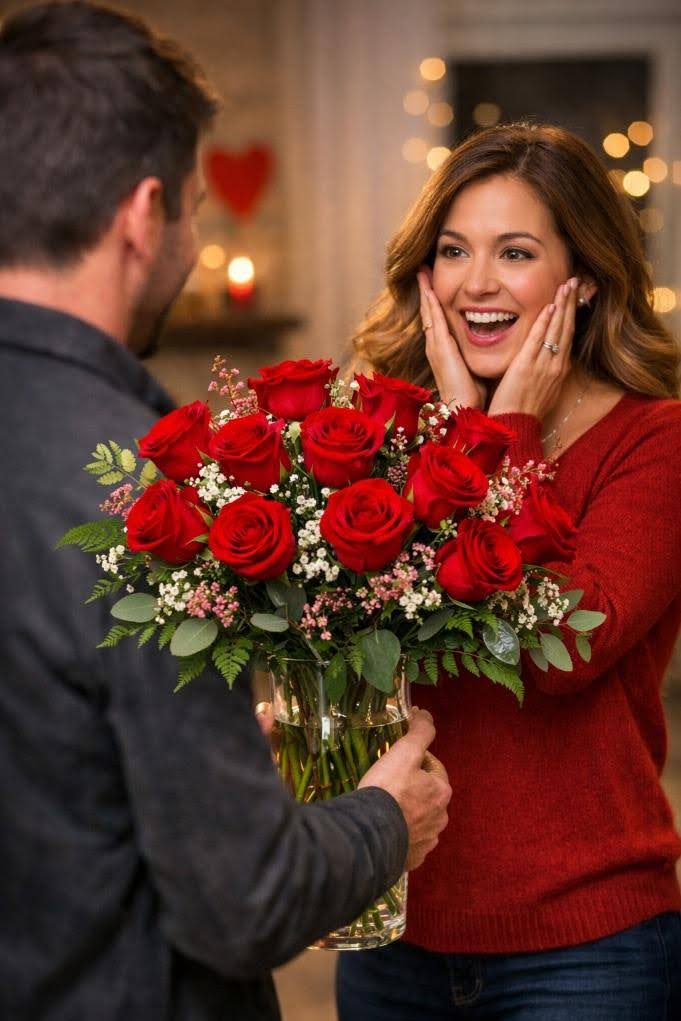
But the single most important customer on Valentine’s Day is still the man who buys flowers only a few times a year for his significant other.
He doesn’t really know what to buy. He doesn’t know what he should spend. What he does know is that he wants to walk into a store, quickly find something beautiful, and walk out confident that he made the right choice.
Overwhelmingly, he buys a vase arrangement that includes at least a dozen roses. The average retail on those items is typically north of $45, and in many markets, he can easily be guided toward $65, $75, or more, if the merchandising makes the decision simple and clear.
He is not coming in to browse. He is coming in to solve a problem. Our job is to make that solution obvious.
Three Stores, Three Very Different Outcomes
We all walk stores in the final days leading up to February 14th, and especially on the 14th itself. Retail leaders visit as many stores as they can. Growers visit their largest customers’ stores and competitors. When you did so, you likely saw one of three very familiar scenarios:
Store One: Calm, Clear, and Ready
You walk in mid-morning on Valentine’s Day and immediately see three strong displays of vase arrangements. Each display is organized by a single price point. The most premium arrangements are positioned right at the front, confidently presented.
Men walk up, scan quickly, select, maybe add a balloon or plush, and head to the registers. The displays are being constantly reloaded. You notice that the team has plenty of pre-made arrangements staged in refrigerated storage. Store labor, not just floral designers, is helping keep the tables full.
Even after the lunch rush, the displays still look abundant. They do not look “shopped.” The after-work rush will see the same fullness.
This is one of your highest-performing floral shops year after year. Sales per square foot are strong. Gross margin dollars are strong. Shrink is best in class. And you leave knowing they are going to set another record.
Store Two: Good Intentions, Mixed Message
In the next store, you see one large display at the front. It includes vase arrangements, upgraded plants, consumer bouquets, and smaller budvases, all together.
The retails are mixed. An $85 arrangement sits beside a $12 plant and a $39.99 basic rose arrangement. There are signs, but they are not cohesive.
Men stand there a bit longer. They pick up items and put them back down. Many grab the first arrangement with a dozen roses and move on, often at a lower retail than they would have willingly spent had a stronger option been clearly presented.
As the day progresses, the display is consolidated. Tables are removed. Product is pushed forward.
The store may have decent sell-through. It may even show sales growth. But you know there was an opportunity left on the table.
Store Three: Hard Work; Missed Structure and Opportunity
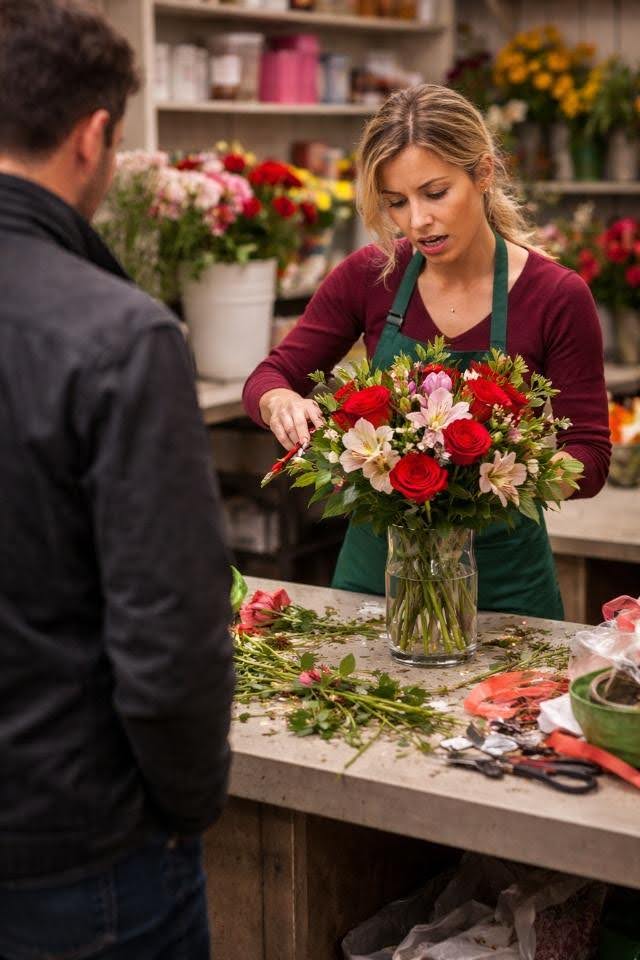
In the third store, it is mid-afternoon. The lunch rush clearly hit hard. The coolers look shopped.
You see a line of men holding consumer bunches and bouquets. Two designers are working feverishly behind a table, creating custom arrangements one customer at a time. Each interaction takes ten minutes or more.
Some customers wait patiently. Some grab a lower-priced bouquet and leave. A few may walk out entirely.
A store leader is pulling a pallet of boxes of cut flowers from the backroom into the floral shop. He looks worried and has been clearly working harder than he normally does. When you approach him, he smiles but shakes his head. “We’re doing our best. You know her customers like her to make their flowers custom while they wait. By the way, I think we may have ordered too much; I still have another pallet in the back. Do you know if another store needs anything?”
You shake your head but thank him for his support.
The team is working hard, very hard. But the structure of the plan has limited the outcome. They are reacting rather than executing a pre-built system.
As a leader, you know that by February 14th, there is very little you can do to change that result. The plan was built months ago.
The Metric That Tells the Story
Now that the holiday is over, we move from observation to analysis.
There is one simple metric that, in my experience, clearly differentiates these three stores:
Vase Arrangement Sales as a Percentage of Total Floral Sales on February 14th.
For most companies, this is an easy number to extract. Vase arrangements typically sit in a defined POS category. A simple query and spreadsheet will reveal the percentage.
When you group your stores by this metric, a pattern emerges almost every time:
Stores above 50 percent mix are typically your highest in sales per foot, gross margin dollars, and overall contribution. Shrink percent is often much lower. This small group is your best stores year after year.
Stores between 40 percent and 50 percent are strong performers, often very close to your top tier.
Stores between 30 percent and 40 percent may show growth but lag in margin and profitability.
Stores below 30 percent are usually your most challenged in overall performance.
Why does this happen?
Because higher vase mix shifts the sales toward higher retail, higher margin items. It ensures that the most important Valentine’s customer got what he wanted, and that the majority spent more in the process.
What Leaders Should Do With This

First, measure it. Do not assume.
Second, set a goal. For many chains, a 45 percent vase mix should be a minimum target. Top operators should be pushing toward 50 percent.
Third, plan backwards. Before orders are finalized, stores should be able to demonstrate that at least 45 percent of their planned retail dollars are tied to specific vase arrangements across three price points. Production plans, recipes, labor, and refrigeration capacity must align with that target.
Fourth, let your best stores lead. Managers in the 50 percent and above group should be coaching those below 30 percent. Peer-to-peer guidance is powerful.
And finally, support them with tools, photo merchandising guides, recipe cards, ordering calculators, labor planning frameworks, and refrigeration strategies. Your highest-volume stores may need over a thousand vase arrangements ready to go that morning. That level of readiness requires intentional structure.
A Word to Growers and Suppliers
Growers, do not just present bouquets. Show your retail partners how those bouquets can be converted into three clear vase price points with strong margins. Help them see the system.
Hardgoods suppliers, align vase programs to support good, better, best merchandising strategies.
When your retail customers increase their vase mix and profitability, you win alongside them.
Leadership After the Holiday
This conversation is not about criticizing teams that worked tirelessly. It is about building a system that supports them and serves the customer better.
Sales increase.
Gross margin dollars increase.
Shrink percent improves.
Customer confidence improves.
And market share follows.
If you would like help building the reporting framework, production planning tools, merchandising communication, or supplier alignment strategy to move this metric next year, I would be honored to work alongside you.
Likewise, if you’d like to know how this metric and the resulting plan changes to support Mother’s Day customers, I know exactly how that works. Call or email me!
The holiday is over. The leadership opportunity is just beginning.
About the Author
Joe Don Zetzsche is a transformative leader in retail marketing and operations with a passion for elevating customer experiences and fostering high-performing teams. As Vice President of BLOOMS Floral Marketing at H-E-B, he led the transformation of its floral business from a traditional supermarket department into an award-winning full-service floral shop—growing annual sales from $80M to over $300M. Joe now owns and operates Rocking Bar Z.
Published by New Bloom Media
New Bloom Media (NBM) is the first multi-channel B2B media platform dedicated solely to the floral industry across the Americas.
Want more floral industry insights?
Subscribe to our newsletter for exclusive interviews, market updates, and innovation spotlights delivered straight to your inbox.